Satellite Ground Stations Series - Part II

We are back for our second week special on Satellite Ground Stations! If you missed last week’s post you can view Part I here.

PART II

Satellite Ground Station Examples

ESS offer different varieties of SGS systems that have been installed nationally and internationally:
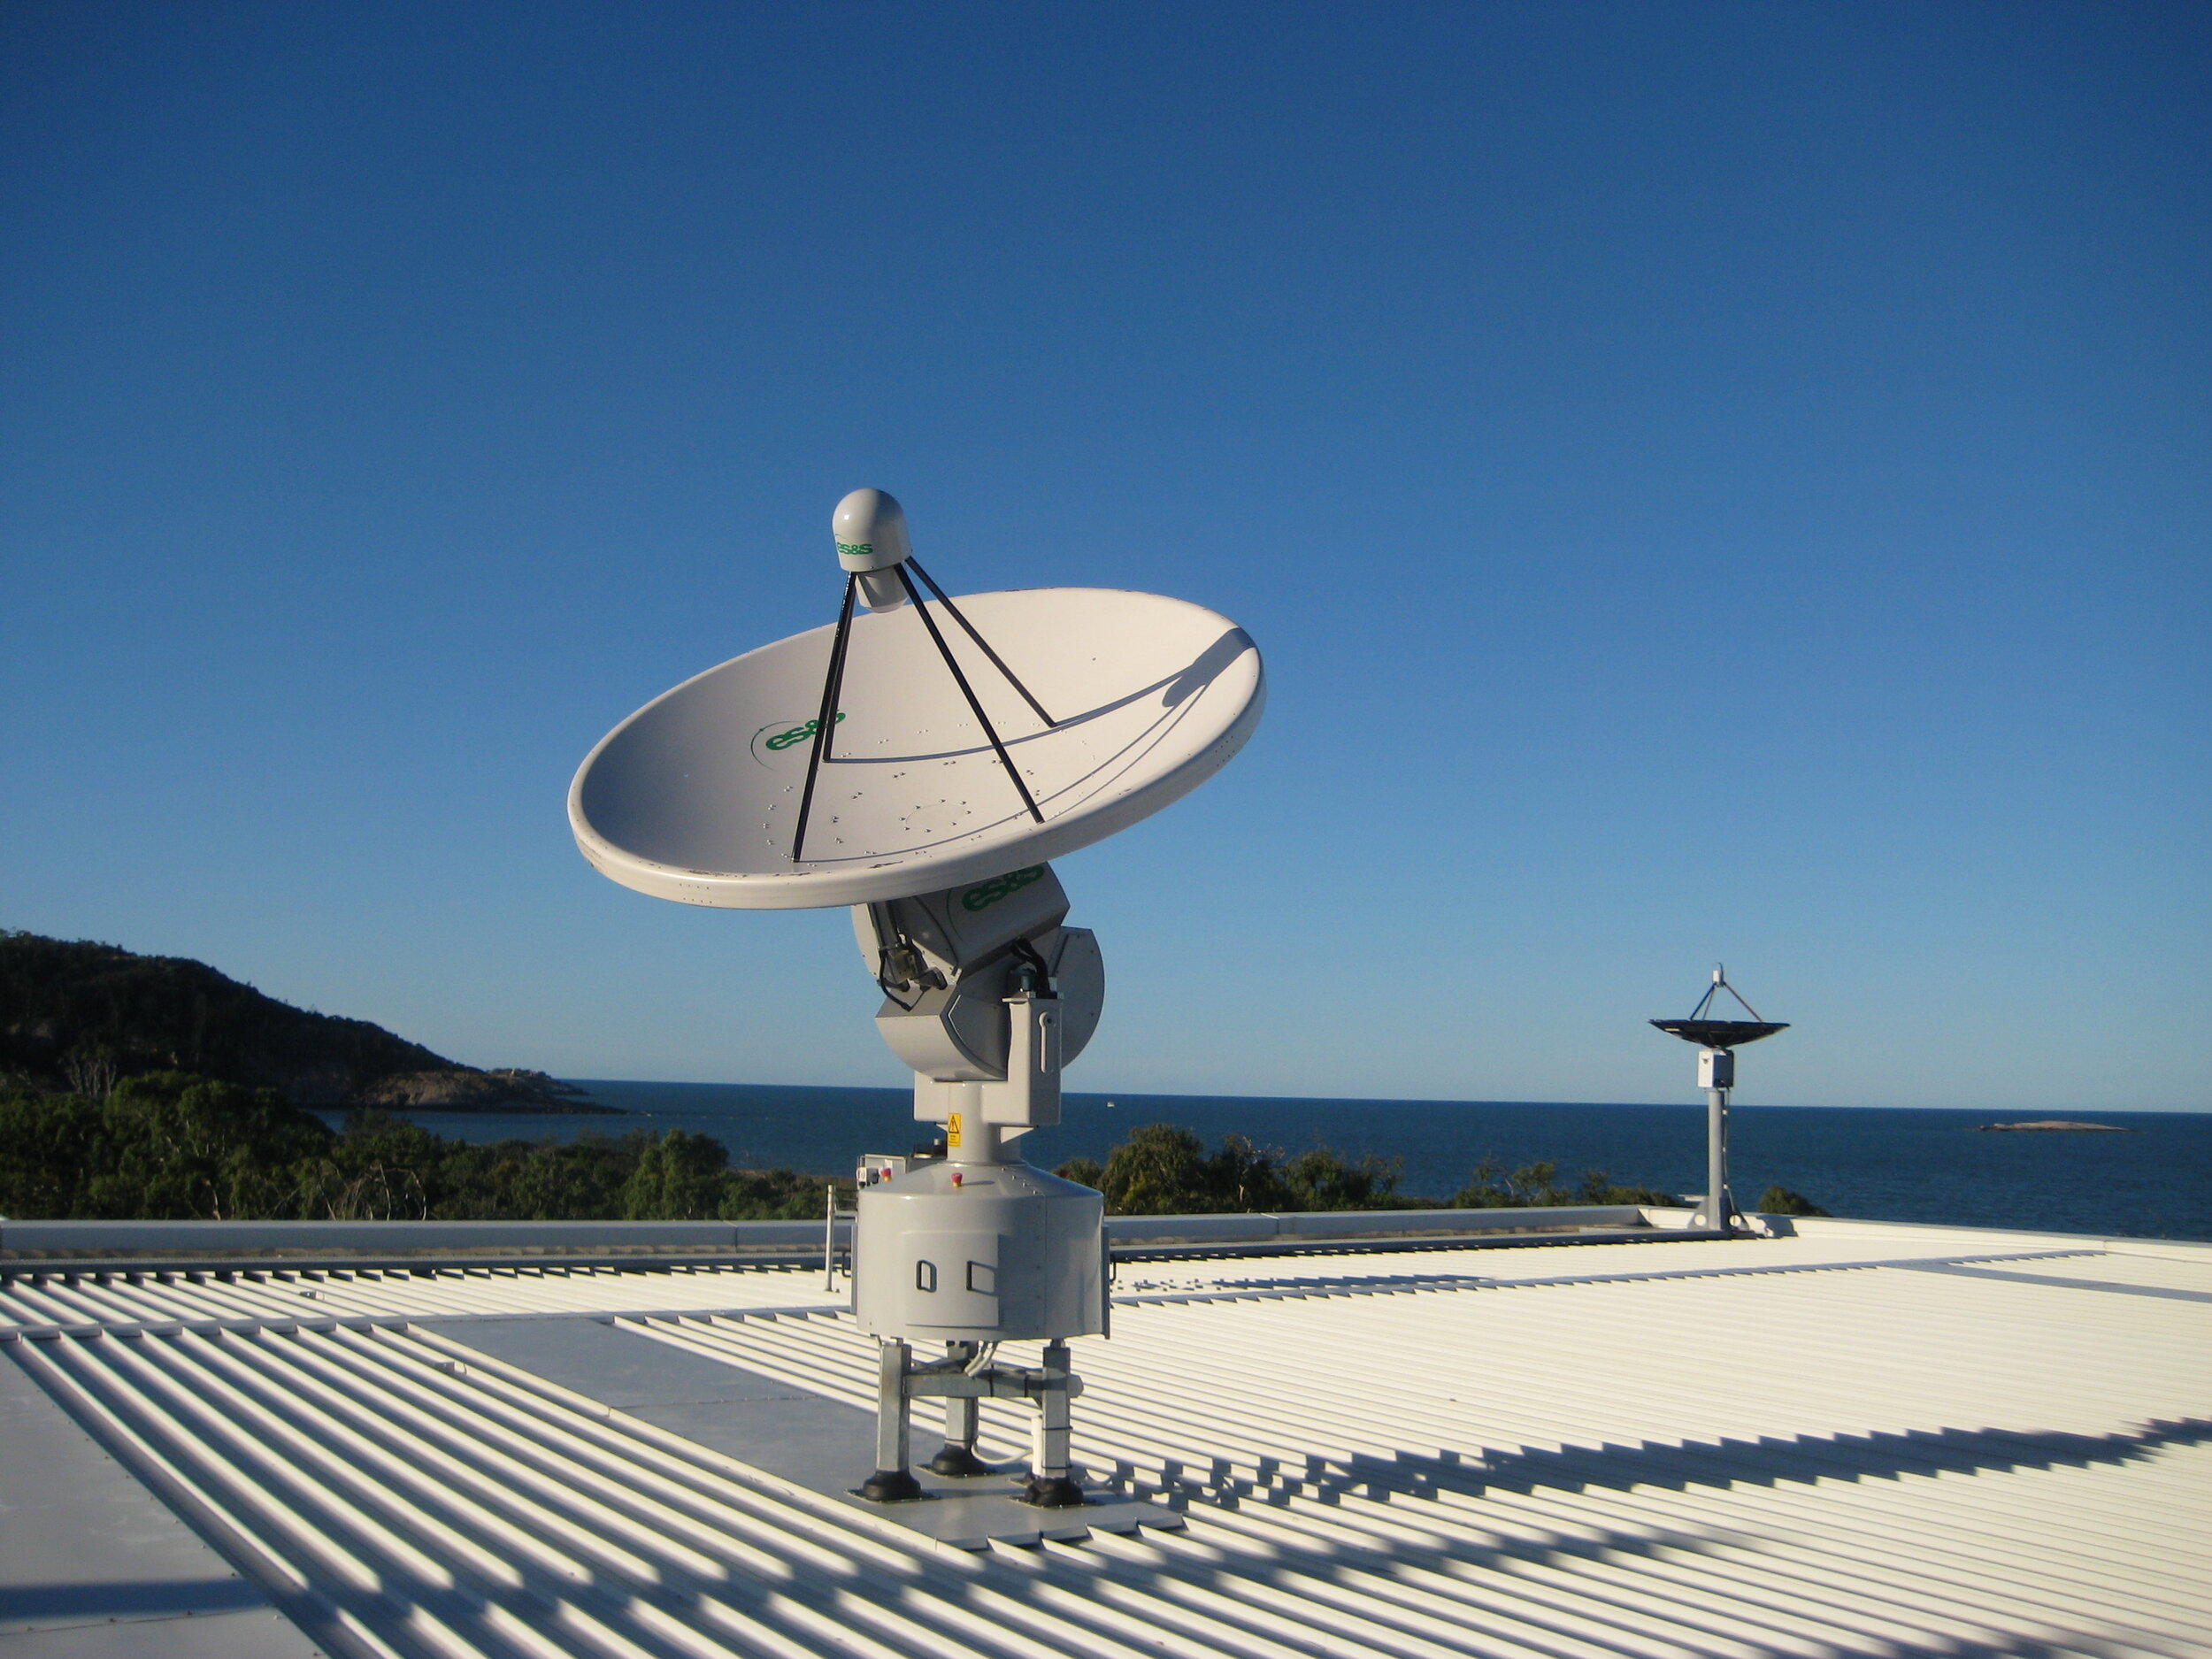
—> Oberon: The Oberon system uses what is called a ‘tracking antenna’, as the name suggests, it tracks the satellites in space, on an XY mount, to collect data from a wide range of polar-orbiting environmental observation satellite systems, including those operated by NASA and NOAA. The Oberon has high precision X and L band reception and has been modified for European applications too to collect from more data sources (for more information see: http://www.eecradar.com/oberon-xl.php).

These systems are not only used for Meteorology and Weather Forecasting, there are also many applications in physical and biological oceanography, hydrology, fisheries, agriculture & forestry, climate and global change studies and land-based change detection studies.

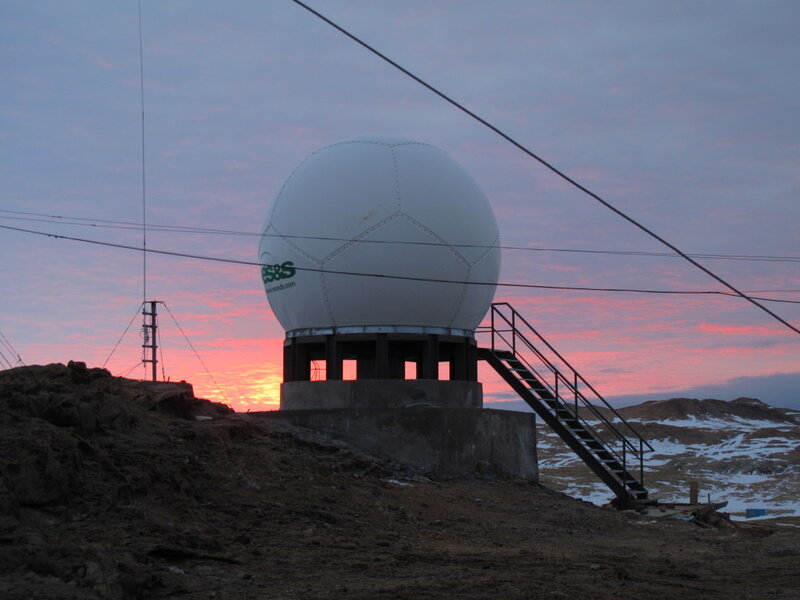
—> Capella and Telesto: The Capella and Telesto systems use a different kind of antenna, called a ‘fixed antenna.’ Once again in the name, suggests that these antennas do not move and are used to collect data from geostationary satellites including the Geostationary Operational Environmental Satellite-R Series (GOES-R). Capella comes with three different antenna sizes: 3.7m, 5m and 6m, depending on the ground location from the satellite. They can be applied in the following areas: Storm detection and tracking, fire monitoring, air quality, coastal and ocean monitoring, hurricane forecasting, rainfall and flood monitoring, land cover observations, volcanic ash detection, lightning detection, and severe thunderstorm prediction (for more information see: http://www.eecradar.com/capella-gr.php).

Telesto is also a geostationary SGS which is capable of picking up a different range of data sources and can be applied in weather forecasting, cyclone detection and tracking and volcanic ash detection and tracking (for more information see: http://www.eecradar.com/telesto.php)

Figure 1: Telesto ground station install for Laos in 2015 procured by the World Meteorological Organisation

Figure 1: Telesto ground station install for Laos in 2015 procured by the World Meteorological Organisation

Lastly, ESS offer a ground station specific to the Japanese Himawari-8 satellite. This includes reception of data that is higher in spatial resolution, more frequent data (every 10 minutes!), an increased amount of spectral bands improving the images produced and can provide visualisation of the following standard products: channels VIS, IR1-4, cloud-top pressure, cloud-top height, cloud-top temperature, cloud type, cloud amount, sea-surface temperature, land-surface temperature and fire points (for more information see: http://www.eecradar.com/himawari-8.php)

Data Types, Sources and Software

There are many satellites orbiting Earth, so satellite ground stations can obtain data from a variety of different sources. Regarding the ground stations mentioned above, for tracking antennas sources can come from the following satellites:   

  • NASA Terra and Aqua; National Aeronautics and Space Administration, United States

  • US NOAA; National Oceanic and Atmospheric Administration, United States

  • EUMETSAT – METOP; European Organisation for the Exploitation of Meteorological Satellites, Europe (Exact countries can be found here: https://www.eumetsat.int/website/home/AboutUs/WhoWeAre/MemberStates/index.html)

  • NSMC Fengyun; China Meteorological Administration National Satellite Meteorological Center, China

  • Suomi NPP; National Polar-orbiting Partnership, United States

  • JPSS-1; Joint Polar Satellite System, United States

And for stationary antennas:

  • GOES; Geostationary Operational Environmental Satellite, United States

  • MTSAT; Multifunctional Transport Satellites, Japan (Note: replaced Himawari-5)

  • FY-2; FengYun-2, China (Translation: FengYun —> Winds and clouds)

  • COMS; Communication, Ocean and Meteorological Satellites, South Korea

  • Himawari-8/9; Japan (Translation: Himawari —> Sunflower)

  • GK-2A; GEO-KOMPSAT-2, South Korea

Note: Typical types of data formats from satellites include - Level 1B, Level 2 products (e.g. sea surface temperature, cloud classification), HDF, NetCDF, GRIB, SYNOP

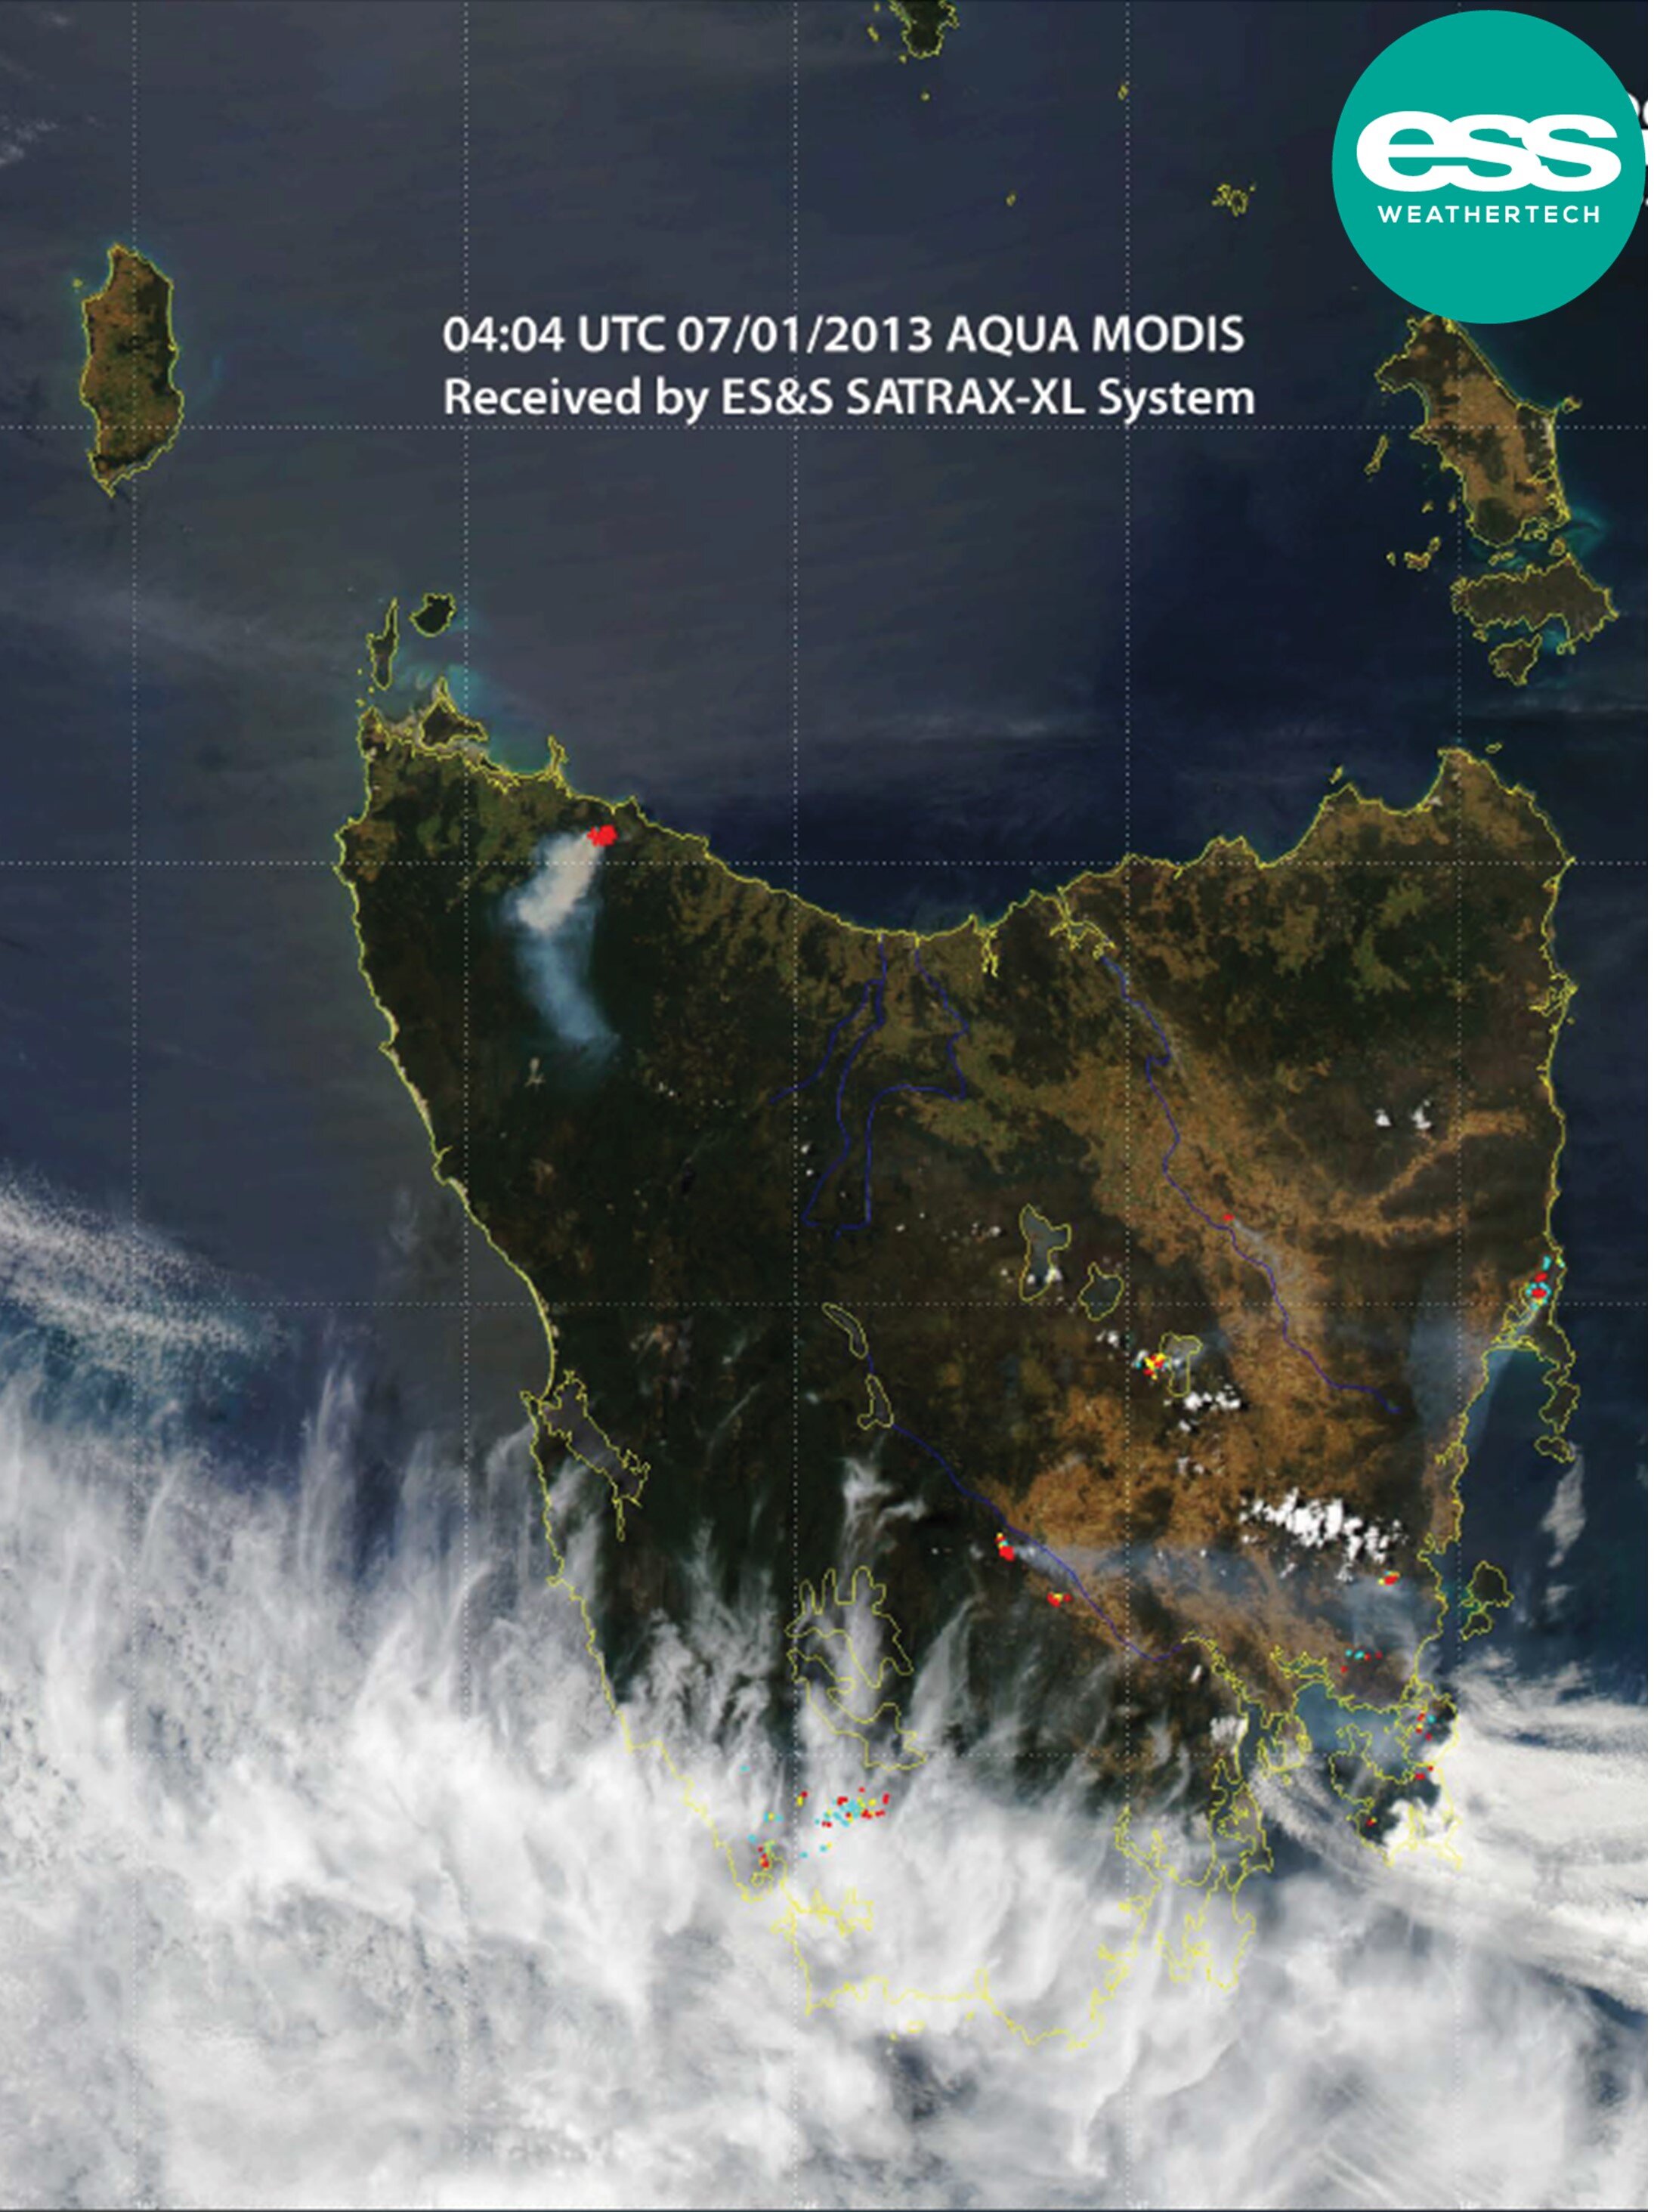
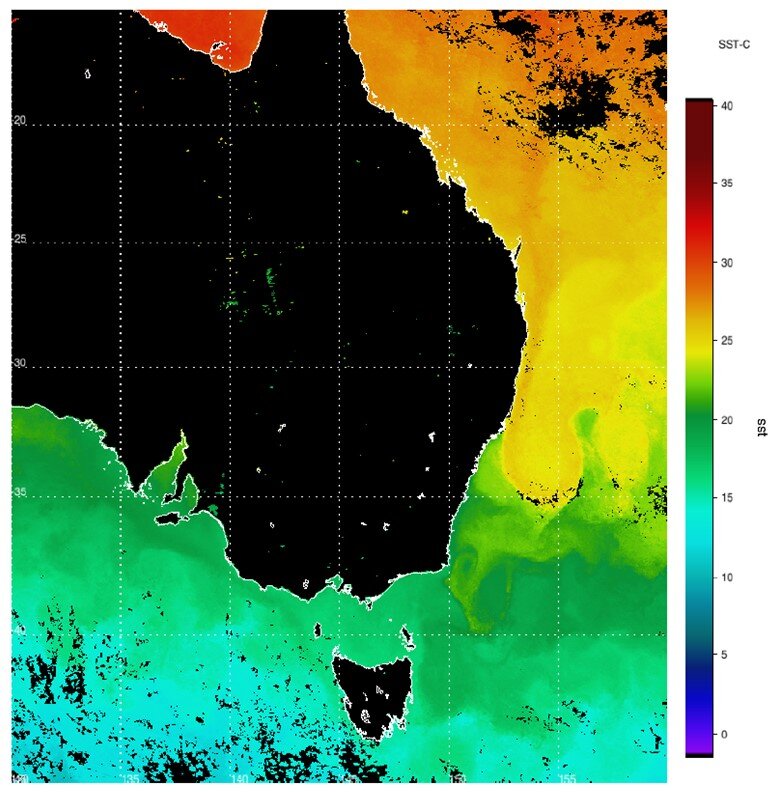
Figure 2 (top): Image of Tasmanian fires in 2013 received by satellite tracking system at ESS Weathertech factory in Melbourne

Figure 3 (bottom): Sea surface temperature representation calculated from satellite tracking system

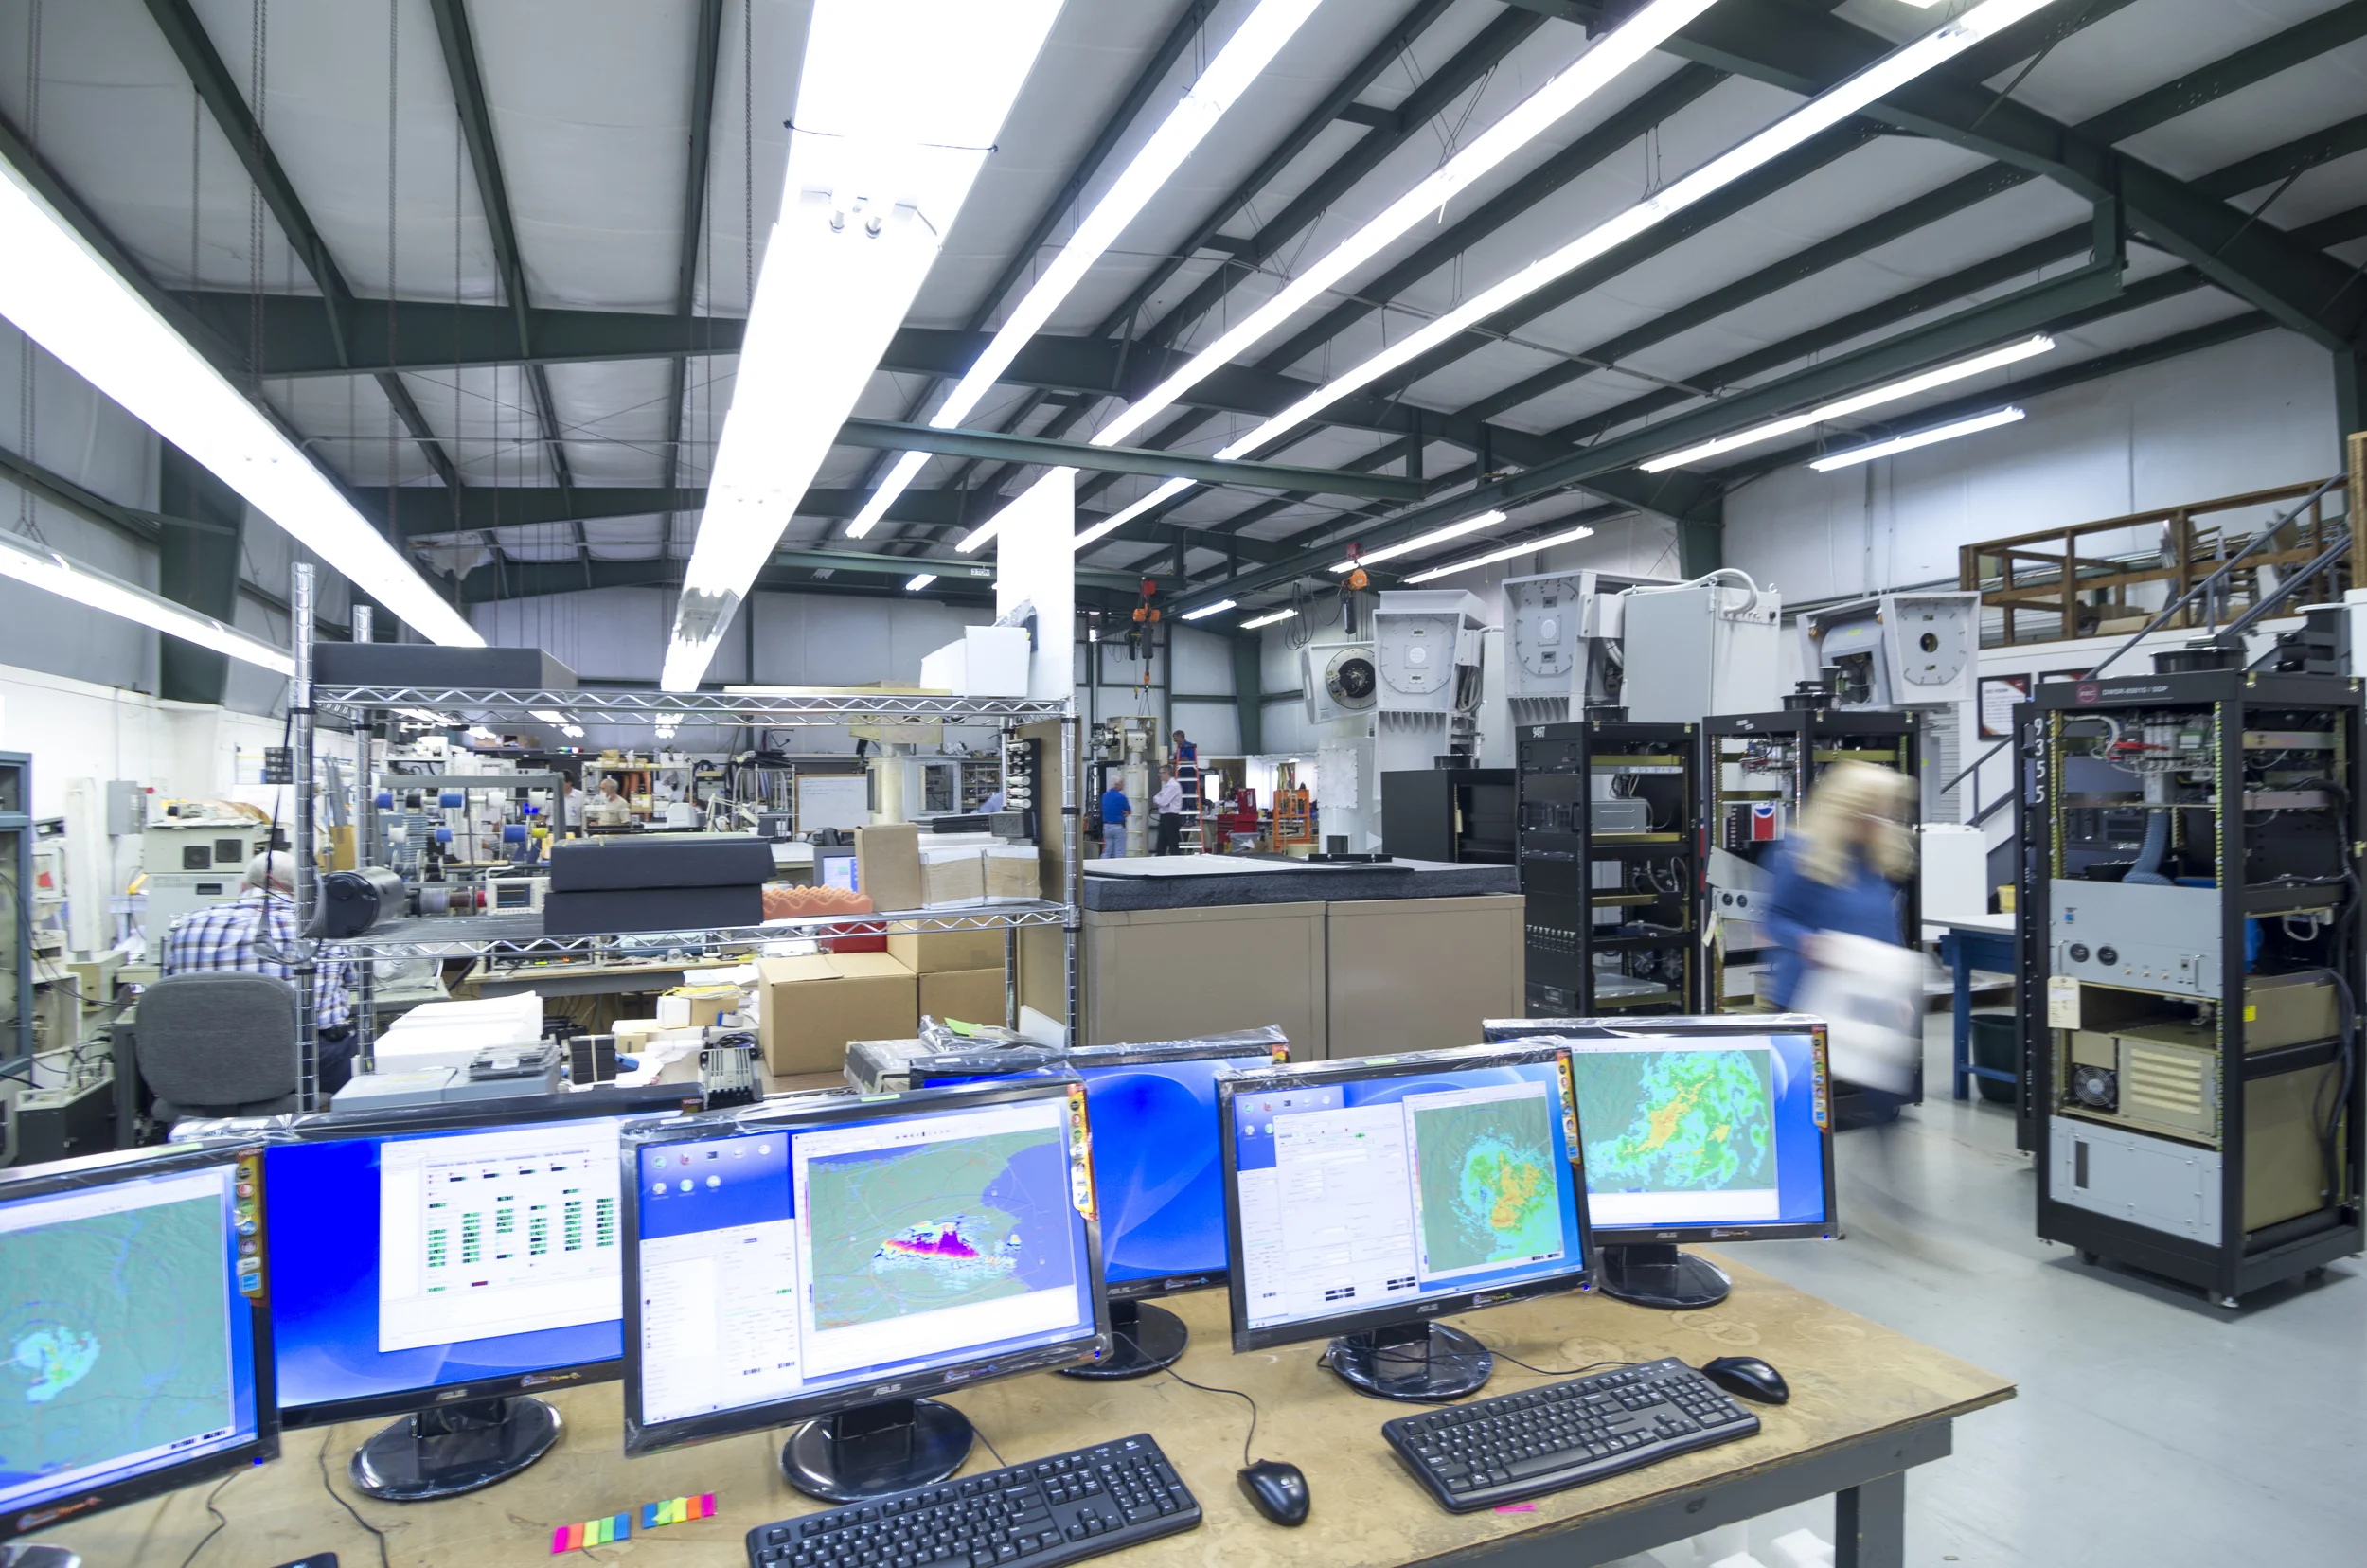
For the satellite data to then be visualised, specific workstations are set up to provide processing power and visualisation. This is so spectacular imagery of various parameters as per Figures 2 and 3 can be produced. ESS provide software known as PROTEUS (soon to be PULSE) and Himawari cast, specifically for the Himawari products.

Please tune in next week for our third and final installment of the Satellite Ground Station series which will be on ESS’ SGS project history! Enjoy the long weekend~

Posted on October 22, 2020 .

Satellite Ground Station Series - Part I

If you’d like to learn more about what a satellite ground station is, please keep an eye out for the next few weeks regarding our series updates which will detail the basics on: What a satellite ground station is, the different types of ground stations and their associated products, and lastly ESS’ involvement in worldwide ground station projects. Now let’s begin!

PART I

What is a satellite ground station?

A Satellite Ground Station (hereafter SGS) is built for collecting and streaming remote sensing satellite data to a variety of users and applications. This may include national weather centres such as the Bureau of Meteorology or research centres like CSIRO who collect weather (and other data) to provide to customers like yourself, the public!

An SGS includes the following main components: a reception antenna, a feed horn, wave guide, and receiver – all typically mounted on a pedestal. SGSs can also be regularly protected by a ‘radome,’ which is the soccer ball looking dome used to cover the antenna. See below.

Figure 1: Top - SGS install at Zhongshan Station in Antarctica (Chinese research station), covered with a protective radome. Bottom - Tracking SGS install in Townsville, Australia.

The antenna is the eye-catching, parabolic dish – this design is beneficial for its ability to accurately direct and reflect incoming radio waves, however the main purpose of the antenna is to amplify the incoming signal without adding significant noise. The smaller antenna located at the focal point of the parabolic antenna is called the feed horn. The feed horn is used to gather the reflected signals from the dish and are transferred to a Low Noise Block (LNB) that converts the signal for further processing, such as demodulation where the original source signal is extracted from the received carrier wave, and eventually is visualised on a computer or television etc.

The electromagnetic waves travelling from distant satellites are only a few trillionths of a watt by the time they reach the parabolic antenna. The dish amplifies these tiny signals thousands of times, without distortion or noise, and focuses them on the feed at the centre. Here, the electromagnetic waves are converted into electrical currents, and in this form, they can be amplified further by the LNB. Finally, they are large enough to be processed by the receiver, where the 0’s and 1’s originally sent by the satellite are recovered after their long journey.

Figure 2: Labelled SGS system of how the data gets from a satellite in space to an image on a computer

Figure 2: Labelled SGS system of how the data gets from a satellite in space to an image on a computer

Then what is a satellite?! A satellite (artificial) is the space equipment that orbits the Earth, collecting the important weather data and transmitting such data back to a satellite ground station, which then receives the data so we can process and visualise it on a computer. (Note: an example of a natural satellite, Earth’s largest, is the Moon!)

What is a geostationary satellite? A geostationary satellite or geosynchronous orbit (GEO) is a satellite that is synched with the orbit of the Earth, where the satellites are placed at 35,786km above the Earth’s equator. At this height, a satellite is orbiting at exactly the same rate as the Earth is spinning (11,000km/hr!), so the ground is stationary below it - which also means that the satellite is not moving relative to the Earth, hence the antenna does not need to move. This means that the satellites are facing and recording data from the same ‘patch’ of Earth constantly. Due to the distance of these satellites, geostationary satellites tend to be lower resolution than polar orbiting satellites, however the continuous coverage is a great advantage!

Are there other types of satellites? Yes! The other type of orbit is known as a Low Earth Orbit (LEO), since it is much closer to the Earth. Because the Earth moves below the satellite, it appears to move across the sky, taking about 10-15 minutes to cross from horizon to horizon. To gather data from these satellites, the dish must move to follow the path, so the ground stations that receive this data are known as ‘trackers.’

Figure 3: Comparison of Geostationary orbits and Low Earth Orbits to the Earth

Figure 3: Comparison of Geostationary orbits and Low Earth Orbits to the Earth

Stay tuned for Part II next week where we will delve into satellite data products and ESS’ various antenna range!

What is Super Computing and how is it useful in Weather Forecasting?

Introduction
Supercomputing is powerful and is utilised typically, but not limited to areas of science and research. ESS Weathertech (ESS) has been specialising in the supply of supercomputing systems for more than 10 years now through different projects that stretch internationally to countries including Nepal, Pakistan and Bangladesh.

To find out the mechanics of supercomputing and more about our contribution to forecasting systems worldwide…keep reading!

What is a Supercomputer?
A supercomputer is a large array of smaller computers and processing equipment that are aggregated to make one large computer. A supercomputer is built for the purpose of solving problems that are far too complex for an ordinary desktop or workstation to process. Ideally the supercomputer will reduce the time to solve problems that may have taken up to months to process and can squash this down to days depending on the procedure and target of the problem.

Supercomputers are generally found in areas of science, engineering, and business to enhance the processing of a complex problem by utilising a large amount of computing power harnessed from each individual node – this method is typically referred to as High Performance Computing (HPC). HPC can be used to run intricate models for forecasting the weather. This is commonly known as Numerical Weather Prediction (NWP) where weather data is processed by the computer for modelling purposes.

Components of a Supercomputer
The main guts of a supercomputer is the computer cluster. The cluster is where all the smaller computers are held, generally in a rack mount, and each different computer is referred to as a ‘node.’ The nodes all have processors/cores just like a desktop computer (for example, Intel or AMD), this is the brains of the computer which executes the instructions. The processing power can be measured in teraflops or petaflops (where a FLOPS is a floating-point operation). To get a gauge on the processing power of an HPC, the National Weather Service in America are running supercomputers that operate at a total of 8.4 petaflops – 10,000 times faster than a regular desktop computer!*

Figure 1. NWP and HPC rack mount in Bangladesh

Figure 1. NWP and HPC rack mount in Bangladesh

Each individual node needs to “talk” to each other which is performed through a communications network. This can be done via an ‘InfiniBand’, which is a standard of networking communication in HPC that helps transfer data between computers with very high throughput and very low latency so that the links between the nodes doesn’t slow down the combined processing speed between nodes.

Other supercomputer components include monitors, keyboards, power distribution, ethernet switches and uninterruptible power supply (UPS). A UPS is very important in case there is a power failure to ensure power is still provided to the supercomputer so the data is unharmed and processes continue to churn away while the system safely shuts down the supercomputer. If the supercomputer is not shutdown appropriately it can corrupt the data or the software which has catastrophic and costly consequences.  All this equipment is normally stored in a rack mount (see Figure 1.) and in an environmentally controlled cool room.

For weather forecasting, and before the supercomputer processes data, the data needs to be obtained from somewhere. Devices such as radar, weather stations, satellite images, profilers and other sensors measure different atmospheric parameters, collect data and send the data to a central database for storage (e.g. NAS – Network Attached Storage) that can then be used by the supercomputer and consequently sent to an archive for long term storage.

Installed on the hardware is software to process, analyse and visualise the incoming data. This ranges from the basics of the Operating Software (e.g. Linux) to GNU compilers (e.g. Python, C++…), math and data libraries (e.g. MATLAB, NetCDF4) to visualisation software like the Grid Analysis Display System (GrADS).

Figure 2. Visualisation of global model topography using GrADS over Nepal domain

Figure 2. Visualisation of global model topography using GrADS over Nepal domain

Numerical Weather Prediction (NWP)
NWP utilises the power of supercomputing in order to calculate the equations that define the flow of fluids in the atmosphere (and ocean too!). The supercomputer implements the method of NWP by translating the governing equations of dynamical meteorology, numerical methods, parameterized physical processes, and initial and boundary conditions into computer code which is then analysed and determined over a specific geographic domain (e.g. Nepal in Figure 2.).

Figure 3. depicts a simple flow chart of the essentials a modelling system (e.g. Weather Research and Forecast (WRF) model) would potentially progress through – NOTE: Figure 3. is one example data route of a much larger flow chart. 

Firstly, data is collected from an external source – this may be observational data collected by a weather bureau (via satellite, radiosondes, weather stations, radar etc.) or this could be model data. This data is then put through pre-processing such as data assimilation. Data assimilation is a processing technique to estimate the optimal state of the evolving weather system by combining observational and numerical model data. Next, the data is run through the model calculations and lastly the data is post-processed and visualised by software such as GrADS.

Figure 3. Data flow through numerical modelling method

Figure 3. Data flow through numerical modelling method

Furthermore, methods of NWP such as ensemble forecasting is used to improve current modelling techniques by producing a more reliable and accurate forecast. This can be done by comparing various different NWP forecasts and combining multiple model runs through statistical and graphical methods to reduce the level of uncertainty of the model outcomes and increase confidence in the accuracy of the final output.

Figure 4. Ensemble modelling example**

Figure 4. Ensemble modelling example**

Project History
ESS has been involved in several international HPC and NWP projects. ESS has extensive expertise working with these software solutions and similar packages, having installed similar modelling systems in Australia, the USA, Bangladesh, and Nepal.

ESS has recently installed a Weather Research and Forecast system in Pakistan for the National Meteorological Service (PMD) as part of a project funded by the Government of Japan. ESS staff currently run the WRF model at the University of New South Wales Mathematics Department providing forecast guidance for a client base. A brief description of some of these projects follows: 

Department of Hydrology and Meteorology (DHM), Nepal – HPC and NWP Project 
ESS experts are currently delivering an NWP and HPC system for the Department of Hydrology and Meteorology, Nepal. This procurement is part of the investments of the Building Resilience to Climate Related Hazards (BRCH) project scheduled for the period 2013-2018. The BRCH project is one of the four projects funded through the Nepal Pilot program for Climate Resilience (PPCR) under the Strategic Climate Fund by the World Bank. 

This procurement focuses on the high-performance computing system needed specifically to operate a mesoscale high-resolution atmospheric NWP model. Currently the Weather Research and Forecast model suitable for providing localized weather and Quantitative Precipitation Forecasts is installed at DHM for test use. 

Figure 5. Low Resolution 27/09 km WRFDA test domain for WRFDA over Nepal for Dept. Hydrology and Meteorology

Figure 5. Low Resolution 27/09 km WRFDA test domain for WRFDA over Nepal for Dept. Hydrology and Meteorology

Pakistan Meteorological Department (PMD) Project
In 2019, ESS completed a three-year project tasked to design, build and deliver a turnkey for High-Performance Computing, including a Forecast Guidance System based on Numerical Weather Prediction data for the Specialized Medium Range Weather Forecasting Center (SMRFC) of the Pakistan Meteorological Department (PMD). This project was funded by the Government of Japan, and the focus is to enable the PMD for a more accurate and timely forecasting of severe weather including heavy rainfall and flooding. The accompanying Forecast Guidance System is based on the Objective Consensus Forecast (OCF) system which is tuned for Pakistan. It uses direct model output of standard meteorological parameters such as temperature, humidity, wind and rainfall from a suite of up to six global and regional models, weighs these according to model performance over Pakistan and produces consensus forecasts out to seven days for 100 towns and cities.

Bangladesh Meteorological Department (BMD) - NWP Project
ESS experts installed and commissioned an HPC supercomputer cluster running the Japan Meteorological Agency regional numerical model over a Bangladesh domain. This project was funded by the Government of Japan, and ESS was a sub-contractor for provision of its experts to undertake the Numerical Weather Prediction scope of the work, which comprises of the following:

o Provision of Operation Software of the HPC Cluster for Numerical Weather Prediction Model (JMA Non-Hydrostatic Model)
o Installation and Adjustment of Operation Software for Numerical Weather Prediction Model
o Contents of Numerical Weather Prediction Model (JMA Non-Hydrostatic Model)

Summary
High Performance Computing has the capacity to provide short term weather forecast by establishing an operational high-resolution local area Numerical Weather Prediction system to provide improved guidance for weather forecasting and to help assessment of rapidly developing severe weather situations.

Outcomes of an operational HPC system include a platform to provide NWP leading to output such as quantitative precipitation forecasts (QPF) for flood forecasting and there-by increase lead time for flood warnings, improve alert services including severe weather and heavy monsoonal rain events, thunderstorms, and flood risks.

These abilities of an HPC are very beneficial to weather services and governmental weather bureaus around the globe. HPC and NWP are continually developing and improving globally to provide services to the public and private sector. Watch this space!

For more information on HPC and NWP from our experts, please contact us via LinkedIn or our website essweather.com

References: *https://www.weather.gov/about/supercomputers#:~:text=NWS%20super%20computers%20hold%20numerical,buoys%2C%20radar%2C%20and%20more.&text=The%20NWS%20has%20been%20using%20supercomputers%20for%20decades
** https://www.weather.gov/media/ajk/brochures/NumericalWeatherPrediction.pdf